- Gold price kicks off the week on a solid footing, as the US Dollar extends weakness.
- China reopening optimism and dovish Fed expectations offset higher US Treasury yields.
- Gold price eyes a fresh upswing toward $1,822 amid a lack of healthy resistance levels.
Gold price is trading close to its best levels in five months above $1,800 at the start of a new week, with risk flows dominating as China expands the covid reopening to Shanghai and Hangzhou. A better risk profile and dovish Federal Reserve expectations continue to remain a weight on the US Dollar, despite a big beat on the US Nonfarm Payrolls data. The US economy added 263,000 jobs in November, better than 200,000 but below 284,000 in October, according to the latest data released last Friday. Following the upbeat US payrolls data, markets appear convinced that the Fed’s dovish pivot could help the economy with a ‘soft landing’. The Fed has entered the ‘blackout period’ and, therefore, all eyes now remain on the US ISM Services PMI and Preliminary UoM Consumer Sentiment data due for release this week for fresh trading impetus in Gold price.
Also read: Gold Price Weekly Forecast: XAU/USD to attract additional buyers above $1,800
Gold Price: Key levels to watch
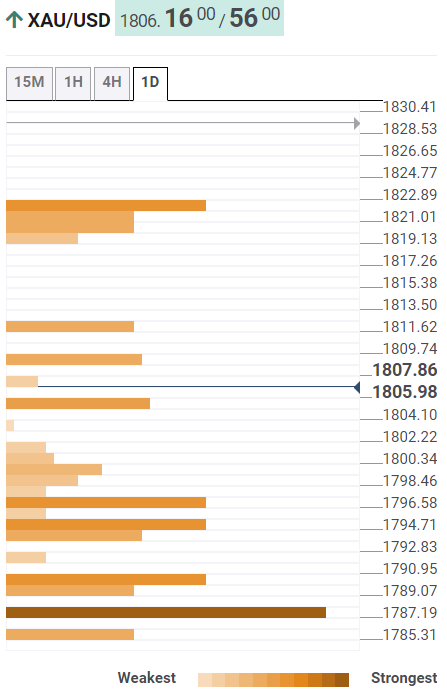
The Technical Confluence Detector shows that the gold price now looks to recapture the pivot point one-day R1 at $1,808.
A sustained move above the latter will put the Bollinger Band one-day Upper at $1,812 under threat.
Acceptance above the latter will fuel a fresh upswing toward the convergence of the pivot point one-week R1 and Fibonacci 161.8% one-day at $1,822.
Alternatively, the immediate support is seen at the previous day’s high of $1,805, below which the previous high four-hour at $1,799 will be challenged.
The SMA200 one-day at $1,797 will be the next downside target, a breach of the last will expose the Fibonacci 61.8% one-day at $1,794.
The line in the sand for Gold buyers is seen at the Fibonacci 23.6% one-week at $1,790.
Here is how it looks on the tool
About Technical Confluences Detector
The TCD (Technical Confluences Detector) is a tool to locate and point out those price levels where there is a congestion of indicators, moving averages, Fibonacci levels, Pivot Points, etc. If you are a short-term trader, you will find entry points for counter-trend strategies and hunt a few points at a time. If you are a medium-to-long-term trader, this tool will allow you to know in advance the price levels where a medium-to-long-term trend may stop and rest, where to unwind positions, or where to increase your position size.
from "price" - Google News https://ift.tt/UnJGOQ0
via IFTTT

No comments:
Post a Comment